프로메테우스 설치 및 사용법
(1)프로메테우스 설치
https://prometheus.io/download/
Download | Prometheus
An open-source monitoring system with a dimensional data model, flexible query language, efficient time series database and modern alerting approach.
prometheus.io
(2) 프로메테우스 실행


프로메테우스를 설치 후 exe 파일을 실행 하면 9090포트로 접속하면 위의 웹 화면이 나타난다.
(3) 애플리케이션 설정
1.build.gradle 설정
dependencies {
    ...
    implementation 'io.micrometer:micrometer-registry-prometheus' // prometheus 추가
    ...
}
2. Actuator 프로메테우스 확인

localhost:8080/actuator로 들어가면 프로메테우스 엔드포인트가 생성된 것을 확인 할 수 있다.
(3) 프로메테우스 설정
1. 수집 설정
(1) prometheus.yml
# my global config
global:
  scrape_interval: 15s # Set the scrape interval to every 15 seconds. Default is every 1 minute.
  evaluation_interval: 15s # Evaluate rules every 15 seconds. The default is every 1 minute.
  # scrape_timeout is set to the global default (10s).

# Alertmanager configuration
alerting:
  alertmanagers:
    - static_configs:
        - targets:
          # - alertmanager:9093

# Load rules once and periodically evaluate them according to the global 'evaluation_interval'.
rule_files:
  # - "first_rules.yml"
  # - "second_rules.yml"

# A scrape configuration containing exactly one endpoint to scrape:
# Here it's Prometheus itself.
scrape_configs:
  # The job name is added as a label `job=<job_name>` to any timeseries scraped from this config.
  - job_name: "prometheus"

    # metrics_path defaults to '/metrics'
    # scheme defaults to 'http'.

    static_configs:
      - targets: ["localhost:9090"]

  # 추가
  - job_name: "spring-actuator"
    metrics_path: '/actuator/prometheus'
    scrape_interval: 1s # 수집 주기
    static_configs:
      - targets: ['localhost:8080']
프로메테우스 파일에 있는 prometheus.yml 파일에 추가된 내용을 더해서 저장한다.
수집 주기는 시스템 상황에 따라 조절해야 한다.
(3) 설정 확인

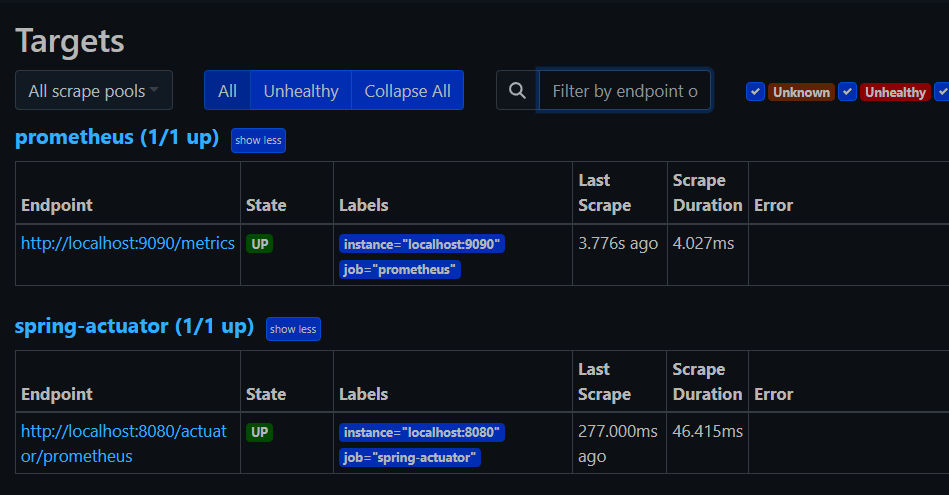
localhost:9090/config와 localhost:9090/targets에 들어가 yml에 파일에 설정한 코드가 제대로 적용 되었는지 확인한다.
(4) 프로메테우스 기능
1. 검색 기능


검색 창에 해당하는 metrics의 이름을 검색하면 그에 해당하는 metric을 테이블이나 그래프로 볼 수 있다 . 그리고 Evolution Time을 조정하여 원하는 시간의 정보를 얻을 수도 있다.
2. 필터 기능

위의 그림에서 error,exception,instance,job,method,outcome,status,uri 등을 레이블이라고 하는데 필터는 이 레이블을 사용하여 {} 문법과 레이블 일치연산자,연산자 쿼리와 함수를 사용하면 필터 기능을 사용할 수 있다.
레이블 일치 연산자
= : 제공된 문자열과 정확히 동일한 레이블 선택
!=: 제공된 문자열과 같지 않은 레이블 선택
=~: 제공된 문자열과 정규식 일치하는 레이블 선택
!~: 제공된 문자열과 정규식 일치하지 않는 레이블 선택
연산자 쿼리와 함수
sum(metricsName):값의 합계를 반환한다.
ex) sum(http_server_reequests_seconds_count)
sum by(레이블)(metricsName): SQL의 group by의 역할을 한다.
ex) sum by(method)( http_server_reequests_seconds_count )
count(metricsName):매트릭 자체의 수를 반환한다.
ex) count( http_server_reequests_seconds_count)
topk(num,metricsName):상위 num개의 매트릭을 반환한다.
ex) topk(3, http_server_reequests_seconds_count)
metricsName offset time:현재를 기준으로 time만큼의 과거시점의 데이터를 반환한다.
ex) http_server_reequests_seconds_count offset 10m
metricsName(time):time동안의 모든 데이터를 반환한다.
ex) http_server_reequests_seconds_count(1m)
(5) 프로메테우스 게이지

게이지: 임의로 오르내릴 수 있는 값으로써 그래프로 특정시간의 정보를 확인하기 쉽다.
ex)CPU사용량,메모리 사용량,사용중인 커넥션
(6) 프로메테우스 카운터

카운터:단순하게 증가하는 단일 누적값으로 서 계속 증가하는 그래프를 가진다. 이렇게 증가만 하는 그래프에서는 특정시간에 얼마나 http요청 수가 들어왔는지 확인하기 어려우므로 increase(),rate(),irate()와 같은 함수를 이용하여 이러한 문제를 해결 할 수 있다.
ex)HTTP 요청 수,로그 발생 수
(1)increase함수

increase()함수를 사용하면 지정한 시간 단위 별로 증가를 확인 할 수 있다.
(2)rate함수

지정한 시간당 초당 평균 증가율을 계산하여 나타내준다
(3) irate 함수

지정한 시간당 초당 순간 증가율을 계산하여 나타낸다.
급격하게 증가한 내용을 확인하기 좋다.
(7)공식 메뉴얼
https://prometheus.io/docs/prometheus/latest/querying/basics/
Querying basics | Prometheus
An open-source monitoring system with a dimensional data model, flexible query language, efficient time series database and modern alerting approach.
prometheus.io